Introduction. This is the page where you can stay up to date relative to the sea ice extent in the Arctic. There are twelve charts below for the latest twelve months of data from the NSIDC, the National Snow and Ice Data Center.
This page includes graphs showing sea ice extent by month since 1979. You will see below that records are being set for each month for the lowest ice extent on record.
What about that Crisis in the Arctic?
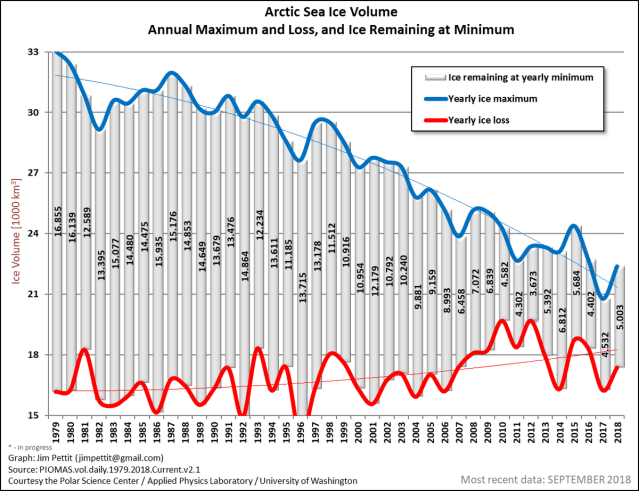
When we’re talking about something this serious, I always like to have hard data, like the “charts and graphs” mentioned above. To convey my preference for data over opinions, this image has been sitting on my desk for the better part of twenty years.

The graph below tracks the sea ice volume in cubic kilometers. The gray bars below represent the volume of Arctic sea ice in thousands of cubic kilometers at the minimum level each year (occurs in September). For the past eight years, it has been about 75% less than the volume in 1979, when satellite imaging began. When the blue line touches the red line, there will be no ice in the Arctic Ocean.
This chart is the minimum sea ice for 2018, occurring again in September.
Earlier this year, I reached out via email to Dr. Peter Wadhams of the University of Cambridge to get his input on some alarming events that were taking place in the Arctic. He feared that this year would be the one where there was zero sea ice in the Arctic for at least part of September. Fortunately that did not happen, but probably will before 2023, five years from now. His response appears just below his image.
Dr. Peter Wadhams, Professor of Ocean Physics, University of Cambridge
July 16, 2018
Dear James,
Many thanks for your message. The Arctic ice has been behaving in a new way. In terms of annual mean extent, it is lower than ever before, but the decline in volume is spread throughout the year rather than being focused on September.
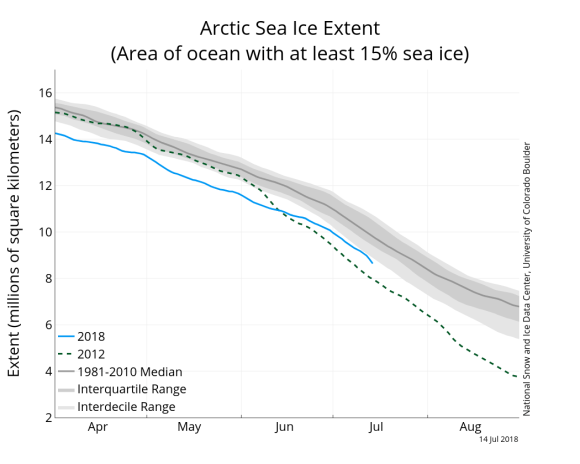
The above graph shows this – the ice extent is paralleling the average at a lower level rather than diverging from it as summer approaches, but you can also see this if you go right back to last autumn. The ice is switching to a significant decline at all seasons, so an ice-free September, previously thought to be a dire warning, may not happen .
Instead the ice just declines at all seasons until finally it goes altogether.
Best wishes, Peter
So, based on his recommendation, I went to nsidc.org to research the “average monthly sea ice extent” in the Arctic Ocean since August of 2017. Each of the eleven graphs that appear below cover the period since 1979 when satellite imaging of ice cover began.
Note that all of the following twelve graphs reveal that Arctic Sea Ice extent is following the same downward trend that Dr. Wadhams mentioned.
I reviewed this Sam Carana chart with Dr. Wadhams in Feb. 2018, See one minute video below.
Candid Camera: One minute with Dr. Wadhams–NYC Feb. 2018
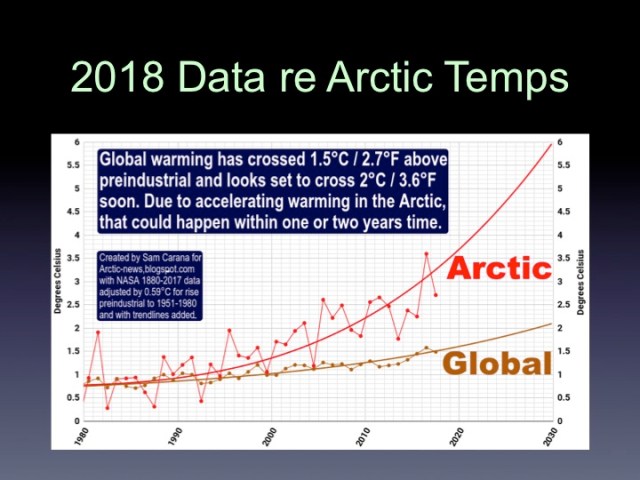
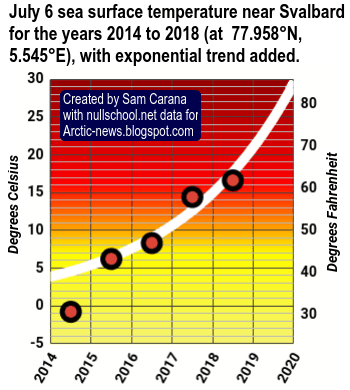
While we’re on the topic of rapidly warming Arctic temperatures, take a look at the graph below that was recently created and posted at the Arctic News Blogspot by Sam Carana. The last datapoint is July 6, 2018. Note that this graph is just a snapshot look at one particular date (July 6) for each of the past five years.
Given that it’s only one day over a five-year pereiod, I would like to think that the sharp temperature increase in this graph is a fluke. But given all the other data, like the above chart, I fear that these numbers may spell big trouble.
Notice that the following nine “ice extent” graphs (from October to June 2018), all seem to be telling the same grim story regarding the disappearance of ice at the top of the world.
The Last 12 Most Recent Months of Sea Ice Coverage in the Arctic
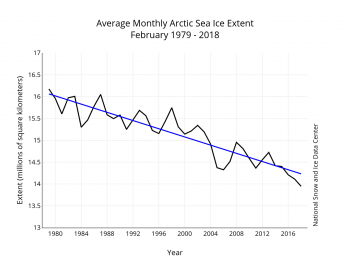
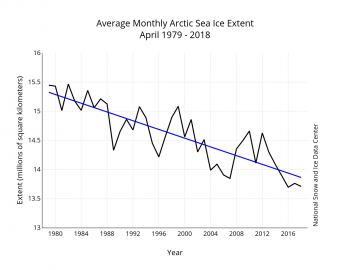
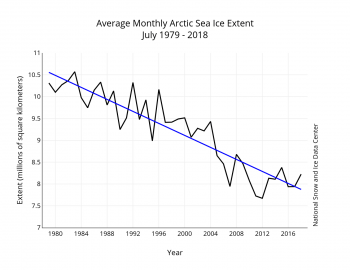
Every single month of the year shows a sharp and continuing decline since 1979. The data is in millions of square kilometers.
November 2017. Average Monthly Arctic Sea Ice Extent (1979-2017)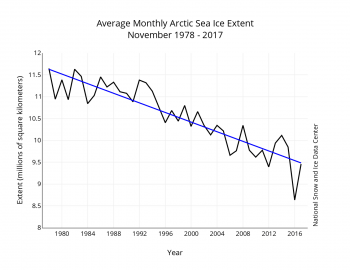 December 2017. Average Monthly Arctic Sea Ice Extent (1979-2017)
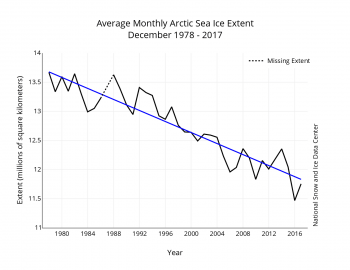 January 2018. Average Monthly Arctic Sea Ice Extent (1979-2018)
 February 2018. Average Monthly Arctic Sea Ice Extent (1979-2018)
March 2018. Average Monthly Arctic Sea Ice Extent (1979-2018) April 2018. Average Monthly Arctic Sea Ice Extent (1979-2018)
May 2018. Average Monthly Arctic Sea Ice Extent (1979-2018)
 June 2018. Average Monthly Arctic Sea Ice Extent (1979-2018)
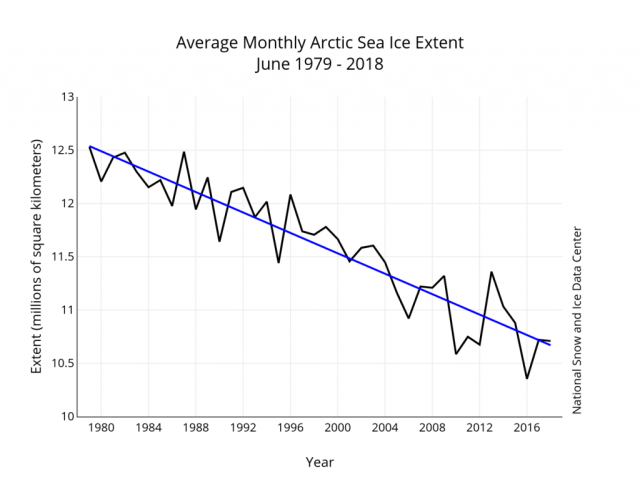
July 2018. Average Monthly Arctic Sea Ice Extent (1979-2018)
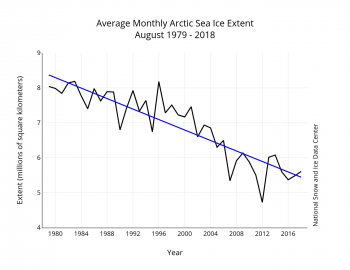
Aug 2018. Average Monthly Arctic Sea Ice Extent (1979-2018)
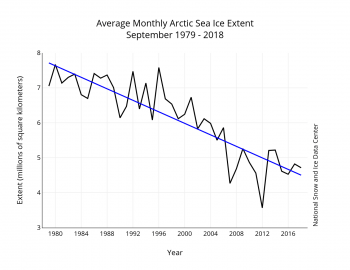
Sept 2018. Average Monthly Arctic Sea Ice Extent (1979-2018)
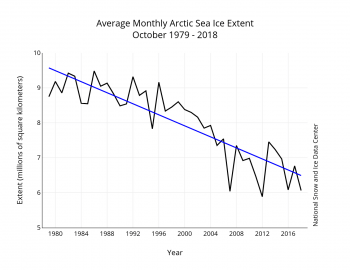
Oct 2018. Average Monthly Arctic Sea Ice Extent (1979-2018)
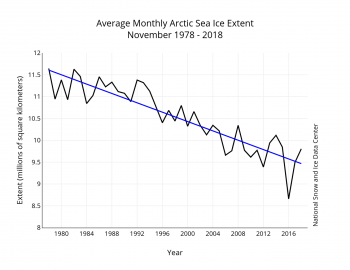
Nov 2018. Average Monthly Arctic Sea Ice Extent (1979-2018)
What’s next? The trend line is steadily downward for every month of the year since 1979. It’s only a matter of time before we have our first ice-free summer in the Arctic. Here are a few related BSBs on that topic.
An Arctic Alert for your Friday the 13th (7-13-18)
From Curiosity about Food Choices to OMG! (7-20-18)

J. Morris Hicks on Fishers Island Sound
I welcome your feedback and questions at jmorrishicks@me.com
Best Regards, J. Morris (Jim) Hicks

The sea ice charts especially the September one look like an inverse head and shoulders chart from a stock market perspective and with record colds having been recorded this winter and the whole grand solar minimum that has started as well as the cooling outer atmosphere recorded by NASA, we may be headed for much colder temps in the coming years or even decades.